Any information essential to the business becomes valuable data. With over 120 zettabytes of data generated daily, the world has a data overload across channels. It’s critical to take a step further from data-based decisions to insight-guided decisions. For that, data needs to transform into ideas and actions for decision-makers to understand when using the correct method so that you can visualize the impact.
In this blog, we uncover what data is and follow it through its journey to becoming insights through well-established KPIs. These indicators are vital in keeping track of progress and help the decision-makers take the correct route to the solution.
Analyzing the numbers that matter
Predictive analytics and machine learning algorithms are helping businesses make reliable decisions by leveraging accurate predictions. They can repeatedly simulate scenarios based on existing data to forecast the business’s future direction and potential standstills. Business intelligence uses these algorithms to teach itself to predict through a KPI.
What turns data into insights?
Data can be processed using statistical and analytical methods to identify patterns and trends. This analysis can involve looking for correlations between variables, identifying outliers, and using machine learning algorithms to uncover hidden insights.
- Statistics: Create patterns that show and identify clear actions and reactions.
- Patterns: Show the reason for a drop or a spike and how to manage it.
- Trends: Contribute and affect your businesses due to the market dynamics.
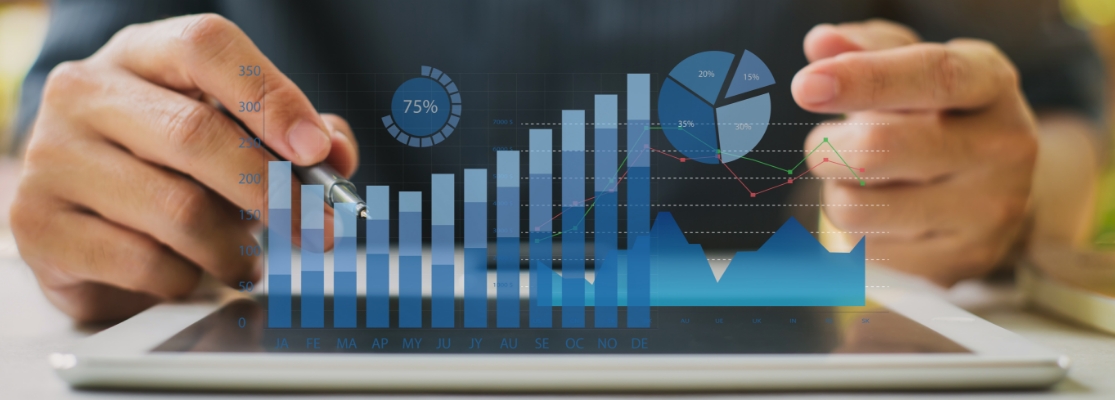
Data visualization can take many forms, such as charts, graphs, and ERP KPI dashboards, and can be used to share insights in an easily understandable and interactive way.
How to create ML projections?
Securing and creating the proper dataset is a task half complete; it has to follow a suitable ML model that can be trained and developed in the required direction. This can be done on a few statistical concepts like linear regression, decision trees, and neural networks.
A process to create an ML model follows:
- Training an ML model is the first step in the process; expect the error to pop up frequently initially, but as you continue to train the model, you can see a substantial improvement.
- As the model’s training continues, it can create projections by getting present in-market data and allowing it to make predictions based on the learned patterns. The projections’ accuracy can evaluate performance metrics such as mean squared error or accuracy.
- Ultimately, the projections must be visualized and communicated to stakeholders using charts, graphs, and other visualization tools. This allows decision-makers to use the insights gained from the predictions to inform their actions and strategy.
Why are well-established KPIs important?
An indicator becomes a KPI when it gives a company the upper hand in three key areas when it affects cost, revenue or it gives strategic advantage. Through measuring specific KPIs, organizations can ensure that their activities achieve their goals and align with their overall growth plan.
KPIs are vital because they:
- Measure performance and identify areas for improvement.
- Ensure accountability and transparency within an organization.
- Provide a common understanding for stakeholders within an organization.
How to measure a KPI?
From selecting the correct methodology to measure the KPI to the data source from the ERP and constant analysis techniques, there are many things to understand before getting to the root of KPI measurement.
After creating the KPI, you need to:
- Understand your goals from the KPI and break down the statistical method.
- Set the targets you want to hit when establishing a KPI to benchmark your process.
- Represent data how your stakeholders need it and create an automated report.
How to accelerate business capacity?
An ERP system can integrate different departments and functions into a single data system to better utilize resources and make informed decisions based on real-time data. Analyzing data is at the heart of growing a business of any size, whether micro-enterprises, SMBs, or from the ground up. Identifying the difference between the to-do list and the wish list is the primary step in accelerating a business; let’s see how that happens.
How to make decisions based on what your company needs vs. wants?
When you can identify patterns, trends, and opportunities that might not be immediately apparent through intuition or experience alone, you make more informed and better decisions backed with insights rather than assumptions or opinions.
- Sales data analysis determines whether there is an actual demand for a new product, the fit into their product line, and what potential impact on profitability. A detailed study can help you prioritize the right features to focus on.
- Financial data analysis is critical to identify inefficiencies in their processes, pinpoint areas where they can cut costs, and optimize their spending. An internal cost report can give you a view of your cash quadrants.
- Manufacturing data analysis is crucial for companies to understand their supply chain and metrics such as throughput, attainment, and utilization. With numbers on your side, you can understand which part of your supply chain needs an upgrade.
What is an actionable insight?
An actionable insight is a suggestion that you can implement in the present to directly impact your business in the future. Let’s take an example of a power grid; sorting and analyzing data in a dataset as vast as running a power grid requires understanding specific organizational metrics.
- The power connection can be from a rural area, a remote area, or an urban area; while the consumption might look the same on a total level, the patterns can vastly differ.
- Average power consumption and the number of homes per household are KPIs that can lead to insights into the distribution industry.
This can follow proper processing until you reach a point where you end up with a to-do list of things you can do today. Likewise, when the concept is applied to the wine and beverage industry, the meaning of an insight changes depending on the KPI.
- These metrics are dependent on different depletions based on the sales and on-hand signals towards the store’s inventory.
- The metrics can depend on RAD, Retail Account Data, which shows whether the store is a chain or a single store.
- The IRR, Inventory Run Rate, can be useful as it checks the details of stock volume at each particular store.
Module development at CI Global: Visualizing data for you
At CI Global, we understand business data can be overwhelming when displaying all numbers without visualization. We build software modules that can extend your ERP’s functionality, create a vision for the future and automate the report with the idea to you as a notification wherever you are.
Now that you know why insights matter, don’t you want to know what we can do for you? Click here.
